
Try SANET
SANET is a toolbox for analyzing events that occur along networks or alongside networks e.g., car crashes on roads and beauty parlors in downtown streets, respectively.
Networks may be roads, rivers, pipe-lines, cables, etc.
What can SANET tools analyze?
SANET provides a collection of ArcGIS-based tools for analyzing events that occur on or alongside a network. Typical examples are: car accidents on roads, burglaries on pedestrian streets, retail stores along streets in an urbanized area, beaver lodges on streams and so forth.
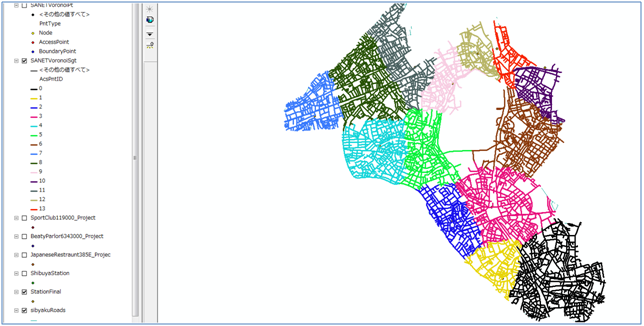
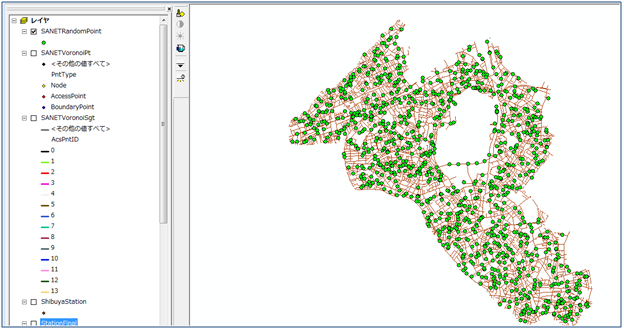
Tool01: Voronoi Diagram
This tool constructs a Voronoi diagram generated by a set of points (referred to as generator points) on a network, where the distance is measured by the shortest-path distance. The resulting diagram, termed the network Voronoi diagram, consists of n sub-networks, where n is the number of generator points. The Voronoi sub-network of the i-th generator point is the sub-network in which the nearest point from every point on the sub-network is the i generator point. For example, if the generator points are bus-stops, the nearest bus-stop for the people living in the i Voronoi network is the bus-stop at the i generator point.
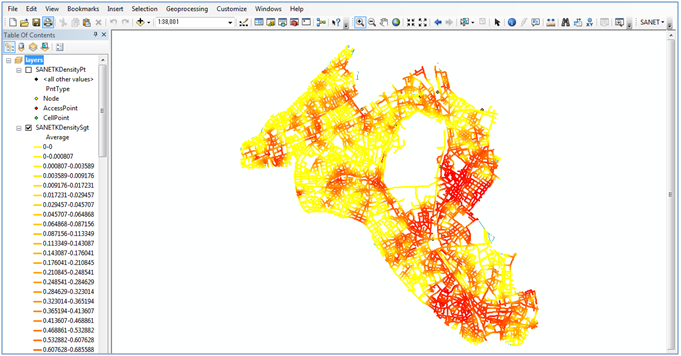
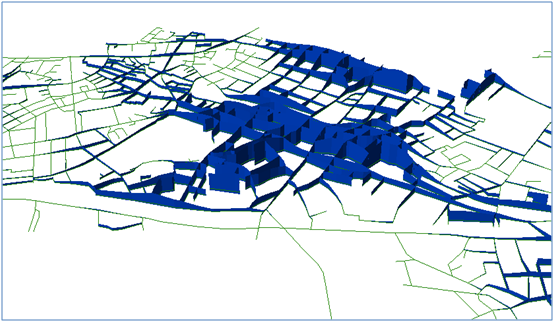
Tool02: Kernel density estimation
For a given set of points on a network, this tool estimates the density function of the points over a network. This tool is useful to detect 'hot spots' of street crimes and 'black spots' of traffic accidents.
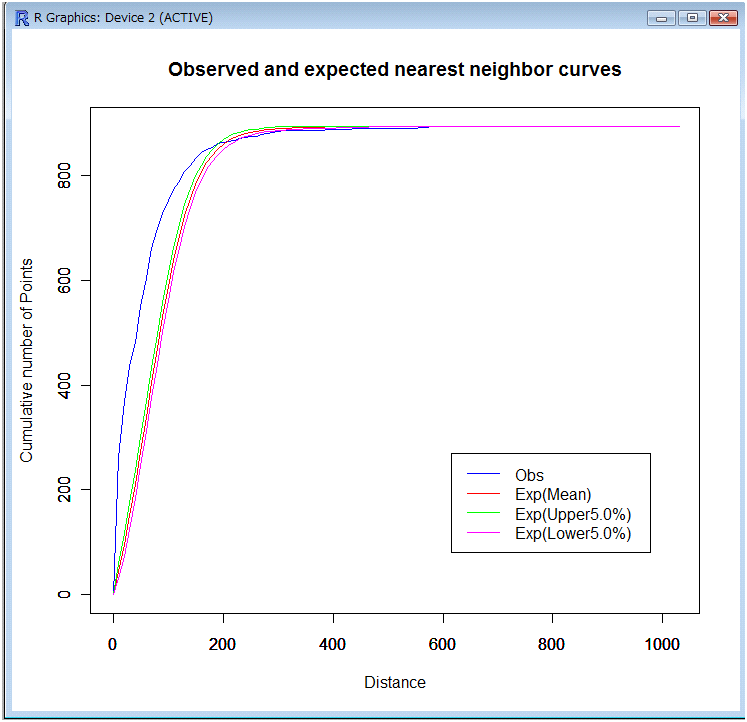
Tool03: Global auto nearest neighbor distance method
This tool tests the complete spatial randomness (CSR) hypothesis in terms of the shortest-path distance from every point in a given set of points placed on a given bounded network to its next nearest point in the set. Note that in the literature, the global auto nearest neighbor distance method is simply referred to as the nearest neighborhood distance method. The CSR hypothesis means that points are independently and identically distributed according to the uniform distribution over the network, or points follow the homogeneous binomial point process on the bounded network. A general description about the nearest neighbor distance method is provided in Chapter 5 in Okabe and Sugihara (2012); specifically, the global auto nearest neighbor distance method is shown in Section 5.1.2 and its application in Section 12.2.2.1.
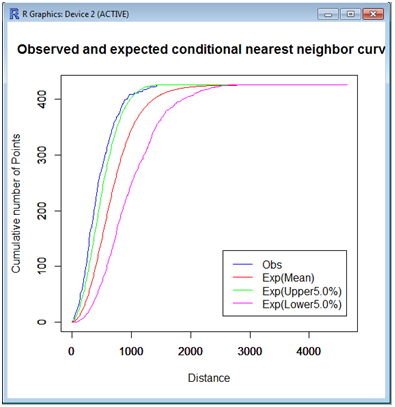
Tool04: Global cross nearest neighbor distance method
This tool tests the complete spatial randomness (CSR) hypothesis in terms of the shortest-path distance from each point in a given set of type B points to its nearest point in a given set of type A points. In the literature, the global cross nearest neighbor distance method is sometimes referred to as the conditional nearest neighborhood distance method. In general, it is assumed that type B points are temporal, while type A points are stable over time; for instance, the former points are restaurants and the latter points are railway stations. This method tests the effect of railway stations on the distribution of restaurants in comparison with the CSR hypothesis. The CSR hypothesis means that points are independently and identically distributed according to the uniform distribution over the network, or points follow the homogeneous binomial point process on the bounded network. A general description about the nearest neighbor distance method is provided in Chapter 5 in Okabe and Sugihara (2012); specifically, the global cross nearest neighbor distance method is shown in Section 5.2.2 and its application in Section 12.2.2.2.
Tool05: Local cross nearest neighbor distance method (in preparation)
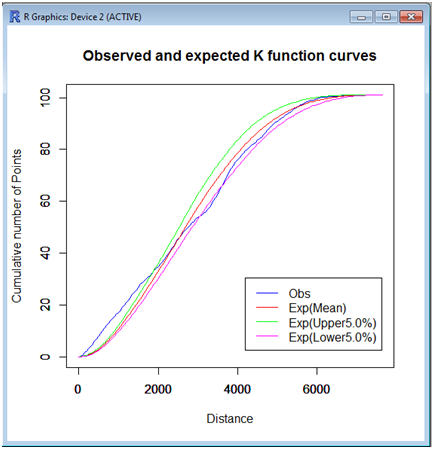
Tool06: Global auto K function method
This tool tests the complete spatial randomness (CSR) hypothesis in terms of the number of points in a given point set satisfying that the shortest-path distance from every point to another point is less than a parametric shortest-path distance. The CSR hypothesis means that points are independently and identically distributed according to the uniform distribution over the network, or points follow the homogeneous binomial point process on the bounded network.
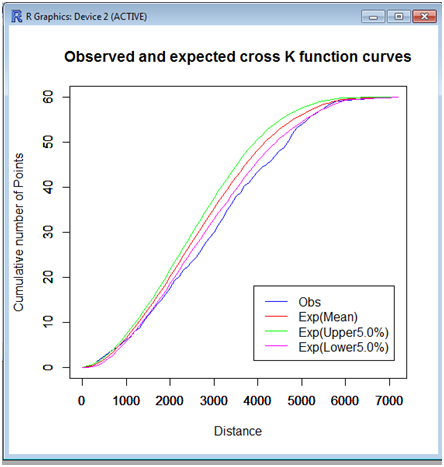
Tool07: Global cross K function method
Given two sets of points, a set of type A points and that of type B points, placed on a given network, this tool tests the complete spatial randomness (CSR) hypothesis. The CSR hypothesis means that points are independently and identically distributed according to the uniform distribution over the network, or points follow the homogeneous binomial point process on the bounded network, implying that the configuration of type A points does not affect the distribution of type B points.
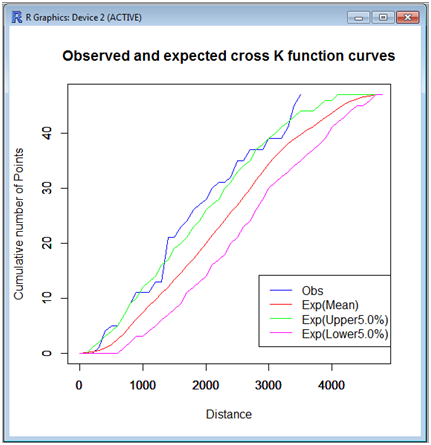
Tool08: Local cross K function method
Given two sets of points, a set of type A points and that of type B points, placed on a given network, this tool tests the complete spatial randomness (CSR) hypothesis. The CSR hypothesis means that points are independently and identically distributed according to the uniform distribution over the network, or points follow the homogeneous binomial point process on the bounded network, implying that the configuration of type A points does not affect the distribution of type B points.
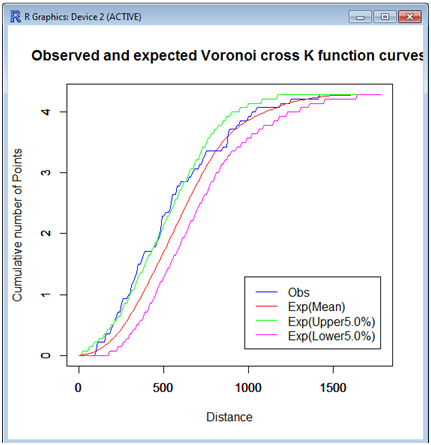
Tool09: Global Voronoi cross K function method
Given two sets of points placed a network: a set of type A points (its number is na) and that of type B points (its number is nb), this tool tests the complete spatial randomness (CSR) hypothesis in terms of the number of type A points that are within a parametric shortest-path distance t from their nearest type B points. To state it a little more explicitly, consider the shortest-path distance from every type A point to its nearest type B point. Note that if a type A point is placed in the Voronoi subnetwork of the i-th type B point, the nearest type B point from the type A point is the i-th type B point. The number of the resulting shortest-path distances is na. Next consider a function, K(t), that indicates the number of type A points satisfying that the associated shortest-path distances are less than t. The tool tests the CSR hypothesis with K(t).
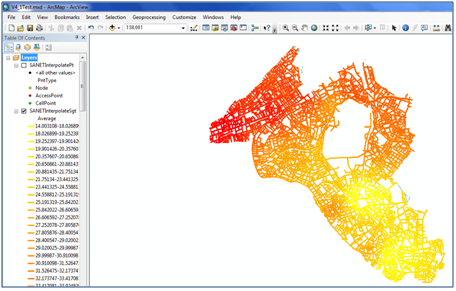
Tool10: Interpolation
For a given set of known attributes values at sample points on a given network, this tool interpolates unknown attribute values at arbitrary points on the network using the inverse distance weighting method.
Tool11: Delaunay diagram (in preparation)
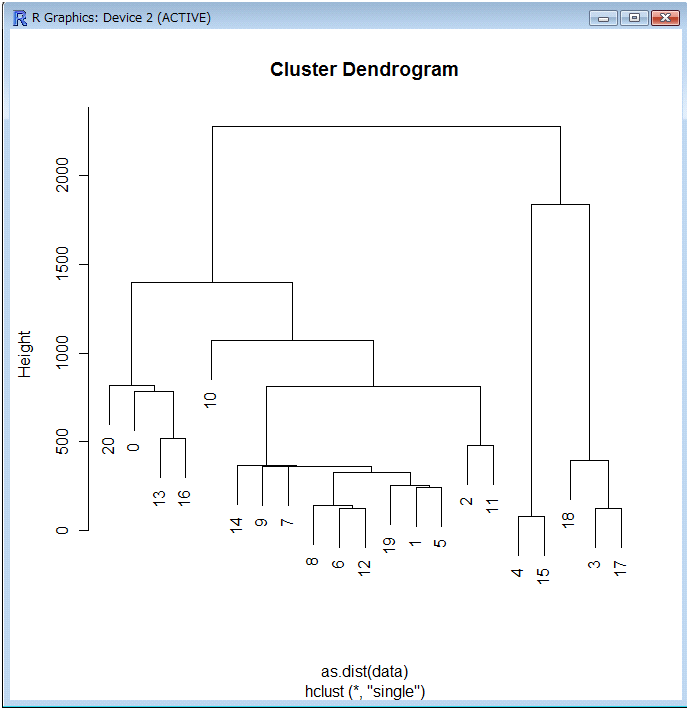
Tool12: Point clustering method
This tool clusters points in a given point set on a given network by the closest-pair clustering method. For details, see Sections 8.1.2.1 and 12.2.4 in Okabe and Sugihara (2012).
Tool13: Random points generator
This tool generates random points on a given network according to the uniform distribution over the network. The resulting points are a realization of the complete spatial randomness (CSR) often used for a null-hypothesis. For details, see Sections 2.4.2 3.4.5 and 12.1.4 in Okabe and Sugihara (2012).
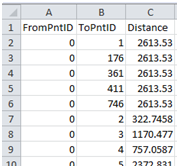
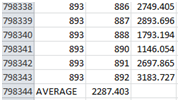
Tool14: Shortest path distance between points in a set of points
This tool computes the shortest-path distances between any pair of points in a given set of points placed on a given network. For details, see Section 12.1.3 in Okabe and Sugihara (2012).
.................
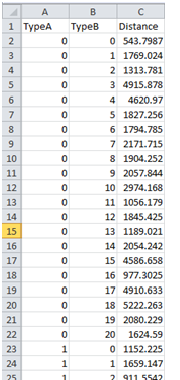
Tool15: Shortest path distance between A points to B points
This tool computes the shortest-path distance from each point in a given set of type A points to each point in a given set of type B points, where those points are on a given network. For details, see Section 12.1.3 in Okabe and Sugihara (2012).
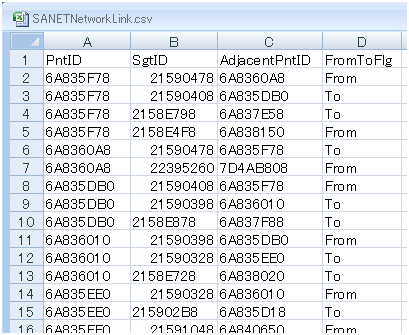
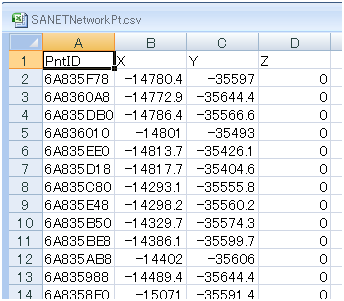
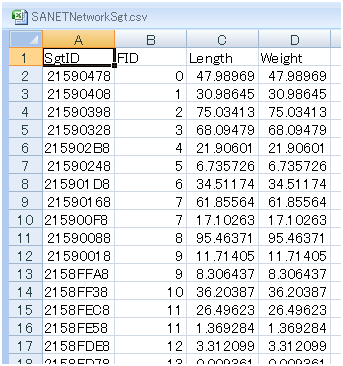
Tool16: Network Characteristics: polylines, points and links
This tool shows the characteristics of polylines, points and links forming a given network.
< BACK TO MAIN MENU